
Market Outlook - March 2021
We have made it through the snowy month of February! Spring is right around the corner, and with spring comes better weather (yay), taxes (boo) and maybe something new for the markets? Let us look at some indicators to see where we are presently.
As a reminder, going into February the weight of the evidence was extremely bullish as the ratios that we follow all seem to be pointed in a positive direction. February historically has been one of the worst months in the calendar year for the market. This year was unique as the S&P500, Nasdaq and several other stock indexes went out at monthly closing highs. This is a continuation of the bullish thesis we laid out last month and it appears to be continuing. The following graph is the monthly chart of the S&P500. As you can see, the pattern is still on an upward trend. We could even see a correction back to 3400-3500 on the S&P 500, it would be painful but the bull market would still be intact. A correction back to those levels would not negate the primary trend, if anything, it would be a normal market occurrence. Markets tend to correct 10-15% EVERY YEAR, ON AVERAGE. Not all corrections are the coming apocalypse or a referendum on anything specific.

Courtesy of Allstar Charts – Advance/Decline statistics, ratio of stocks going up vs down, continues to be positive across all areas of asset size for equites in the US. This is expanding breadth – which means more stocks are participating in the rally, not fewer.

So, what has started to change in the domestic markets? One of the areas we continue to look at is the ratio between growth and value. The chart below is the ratio between growth and value stocks represented through ETFs. For over a decade, growth investments have greatly outperformed value. investments.

As long as this ratio stays below 1.70, value might have its long-awaited day in the sun. Does this mean we should reposition our growth investments and buy value? Not necessarily, but we do need to recognize potential changes in leadership, look for ways to invest in them and consider repositioning long standing holdings, even if it means paying some taxes (more about this in a future blog). This ratio level could also mean that both can do well, just one might do better than the other. A great example on an asset class level was 2003 – 2007 and small vs large caps. The S&P 500 did ok out of the dot.com bust but it was the smaller indexes that really shined. What sectors may we find value investments? Sectors such as financials, energy, and basic materials.
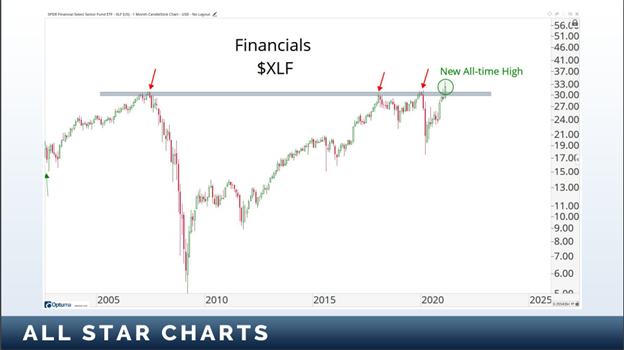
Speaking of financials, here is the monthly chart of the XLF (financials ETF). At the end of February, it finally surpassed its 2007 high. There is an old saying in the investing world, the bigger base (the time it takes from a new all-time high to another new all-time high) the higher in space (greater the upside potential). Financials certainly have that look. Let’s see if it can follow through.
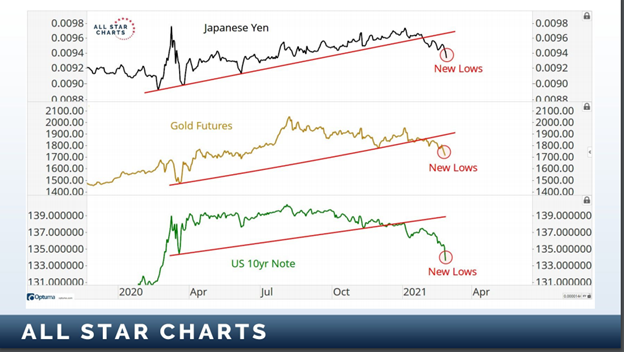
Another notch in the bull camp is that the most risk-off asset classes (gold, Japanese Yen and US Treasuries) are all putting in new 52-week lows on an absolute and relative basis to stocks. This means that money is currently flowing OUT of these “safe” asset classes into the “risky” asset classes of equities (both domestic and international) and commodities.
While gold and other precious metals (except platinum) continue to underperform, industrial commodities are showing strength. Below are charts of Copper, Oil and Steel.
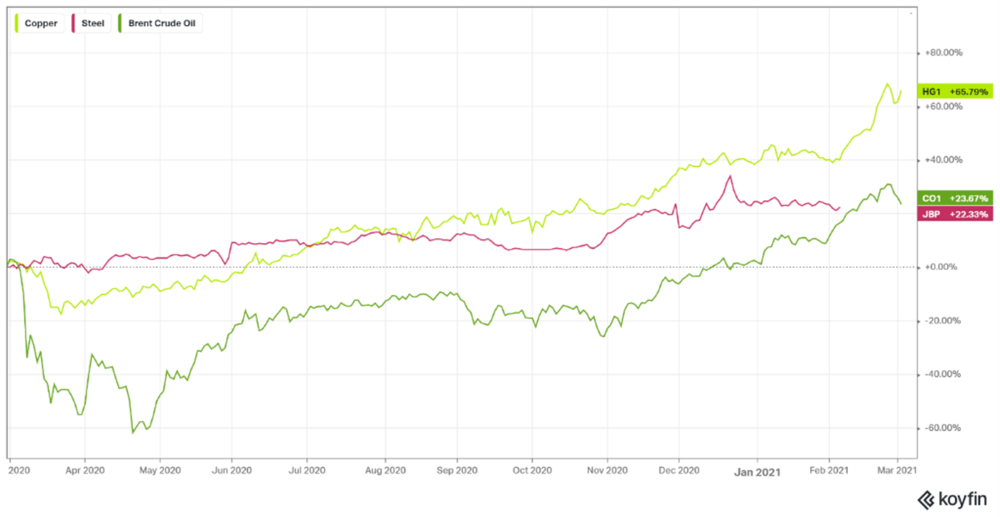
Industrial commodity prices have been used as indicators of global economic growth. There is evidence that we are about to hit a commodity super cycle – meaning that instead of stocks and bonds, commodities will be the #1 driver of performance and economic growth going forward for years to come. Only time will tell but with emerging markets waking up after 13 years (emerging countries are the home to most of these industrial commodities) it is something to monitor closely.
We will continue to monitor the situation and execute on our investment process. The weight of the evidence, at the moment, continues to be positive for equities and commodities. Gold and Silver are at critical areas.
If you have any questions, please reach out to your advisory team.